The Project
A neurobiological research lab at Neurobiology of Aging Department @ ISMMS needed an up-to-date utility for processing high volumes of brain activity data. This data is collected as waveforms which need to be clustered by signal similarity to identify the firing of individual brain cells. The lab inherited an innovative waveform clustering utility from a graduate student’s project.
My job was to redesign the utility for better usability and a wider user base. This required significantly changing the user interface, designing new interactions and creating training materials.
Audit & Analysis
Most of my research was done in the initial discovery stage, but I often came back to some of my investigative methods showcased below in the later stages of the project when I needed to evaluate the results of my prototype tests.
Stakeholder and User Interviews
In the initial discovery stage of the process I conducted a series of interviews to fully understand the objectives of the project. I focused the interviews around business and user goals and understanding existing practices, standards and restrictions.
The stakeholder and user interviews allowed me to develop a clear understanding of the project's overarching agenda and major user groups.
Business Goals:
- Minimize development & maintenance effort
- Improve accuracy, encourage thoroughness (competitive results).
- Reduce learning time for new users (improves onboarding).
User Needs:
- Shorten learning & knowledge refreshment time. ≈ B3
- Shorten task completion (data processing) time.
- Get good feedback about processed data. ≈ B2
Constraints:
- B1 ⇢ Use MATLAB & GUIDES to maximize reuse of the original code.
- B1+B3 ⇢ Minimize additional functions.
User Groups:
Data Analysts: The data analysts process the raw brain activity data to identify individual cell activity. These people use the data processing software nearly every day and are responsible for processing hundreds of files per project. Their background may vary from inexperienced high school student volunteers to post-doctoral fellows with wide experience in the field. Their common goals are speed and accuracy.
Principal Investigators: These people check the accuracy of the data processing and interpret the results. This group consists of professors and post-doctoral fellows who are usually very busy with other tasks, both scientific and administrative. They require very clear and preferably visually distinct feedback about processed data, since they need to quickly, yet reliably, check identification accuracy for thousands of brain cells per project. These users also do not use the software on a daily basis - they usually get a collection of processed files bi-weekly or monthly.
Competitor Analysis:
Through competition product research, testing, and user interviews I learned about the major types of available alternative solutions, identified existing trends and summarized a set of best practices which would give our product competitive advantage and longevity.
Trend Summary:
Comprehensive stand-alone software
Pros:- Wide range of functionality.
- Well-tested and reliable.
- Generalized for multiple applications.
- Designed for end users, works out of the box.
- Steep learning curve.
- Hard to keep up-to-date ⇢ quickly becomes obsolete.
- Confusing documentation.
Scripts for statistical platforms
Pros:- Lightweight and easy to update.
- Updated externally via the base platform.
- Error-prone, poorly tested.
- Have to be tailored to fit new projects.
- Poor usability (e.g. no GUI) – hard to learn and use.
- Designed for programmers, not end users.
- Poorly (if at all) documented.
Conclusion:
Avoid bloating the product with extra functions: let it do few things, but really well.
Capitalize on a consistently updated platform, like MATLAB.
Use popular formats for raw data files and the simplest data structures to ensure wider applicability.
Make UI as self-explanatory as possible.
Provide user-centered, task-oriented documentation and onboarding protocols.
Inventory of Existing Issues:
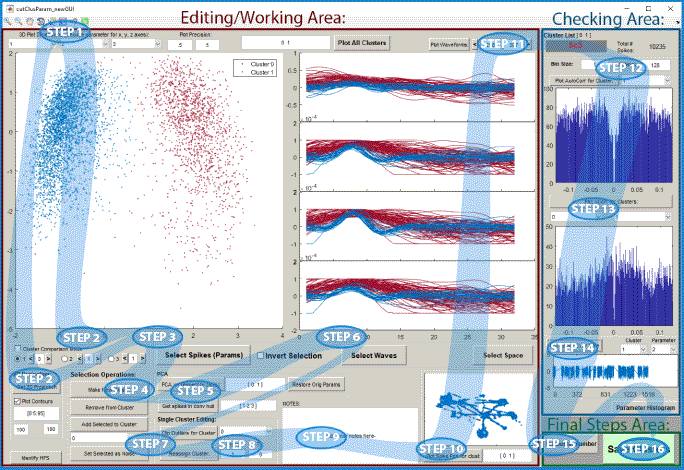
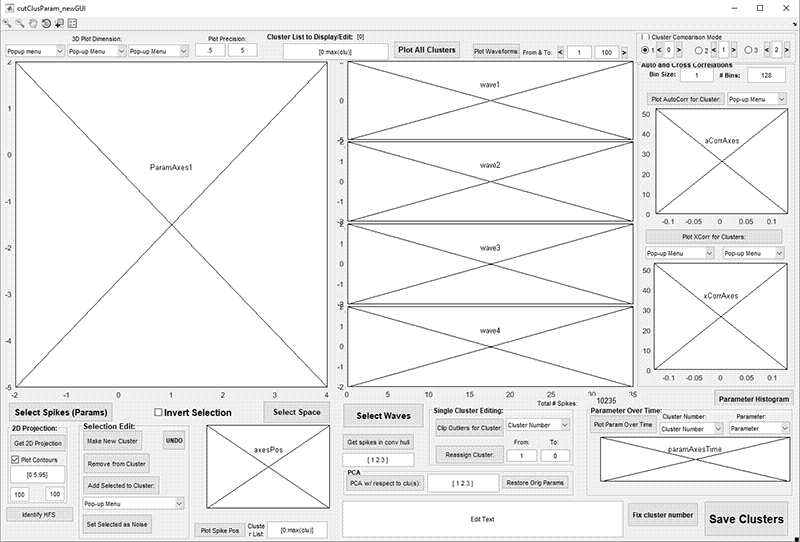
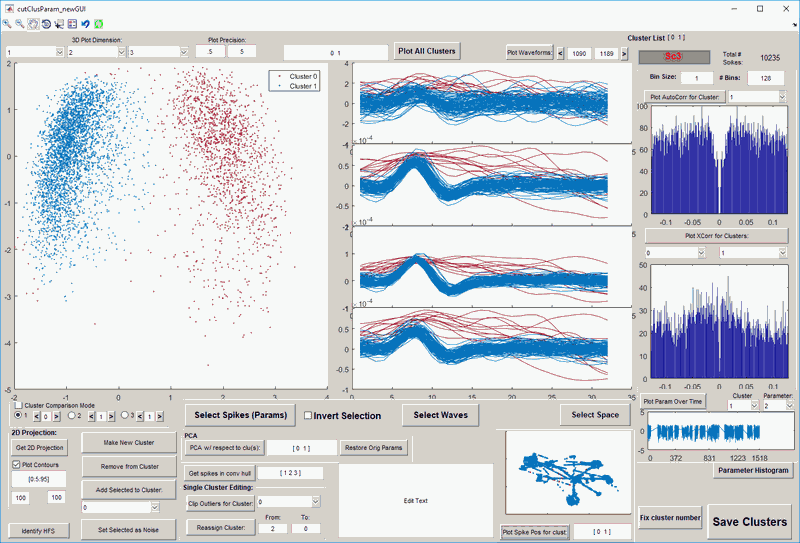
After the initial research gave me a good idea about the overarching goals of the project, I conducted a small set of usability tests to find key pain points in the pre-existing product and see what required immediate redesign. At the end of these tests I compiled an inventory of pressing issues. User observations also revealed the workflow commonalities between different users and projects, and the ways the existing product was not efficiently supporting that workflow. Workflow diagrams helped me visualize the users' common complaints. Example is shown below.
Specific Pain Points:
- Most fields lack descriptors which makes their meaning unclear.
- Button functionality is unclear from captions alone. And some captions aren't even fully displayed.
- Users' preference for left-to-right workflow is not accommodated by the UI. In this example, the diagrams belong to one of the final steps, yet they are in the middle.
- Options with similar functionality are not grouped in any way. Example: selection options for sorting clusters by waveforms, spikes or location are far from each other.
- There is no visual coordination between input buttons and input fields.
- In this area there is no explanation for the entry fields and the plots they affect.
- Most files have too many waveforms to display clearly - they overlap and the visualization becomes useless.
- This checkbox critically affects all selection options, yet there is no label nor explanation to find that out.
- No color consistency in the 3 plots which show different views of the same cluster data: 3D, waves and space. Very confusing.
Key Issues:
- Insufficient features.
- Messy workflow.
- Confusing interface and lack of documentation.
Workflow:
Solutions
After the discovery stage I had a clear map of the areas that needed immediate redesign. However, as I came up with ideas to fix each pain point I was careful to make sure that my solutions link back to the overarching goals. Therefore I tested my prototypes and solutions against their effectiveness in solving the strategical goals.
Solution Ideas:
After several ideation sessions I composed a list of the most promising ideas and evaluated them against the original goals. This gave me a good estimation for priorities and helped quickly eliminate several ideas which sounded good but did not fit into the project's agenda.
- Add labels to all entry fields. ⇢ B2, B3, U1, C1, C2
- Improve button clarity:
- Rearrange functions to follow the user workflow. ⇢
B1,
B3,
U1,
U2,
C1,
C2
Create clusters → Refine clusters → Analyze Clusters. - Make all labels and captions clearly worded and displayed. ⇢ B1, B2, B3, U1, C1, C2
- Add grouping panels around input buttons and the corresponding entry fields. ⇢ B1, B2, B3, U1, C1, C2
- Create visual hierarchy for fields that affect more than one function.
- Replace "number of waves to show" field with "show waves from" and "to" fields. ⇢ B1, B2, U3, C1, C2
- Group all subset-of-data selection tools in one area along with the selection-affecting checkbox. ⇢ B1, B2, B3, U1, U2, C1, C2
- Coordinate data colors on all display plots. ⇢ B1, B2, U3, C1, C2
- Add "UNDO" button and functionality. ⇢ B1, B2, U2, C1, C2
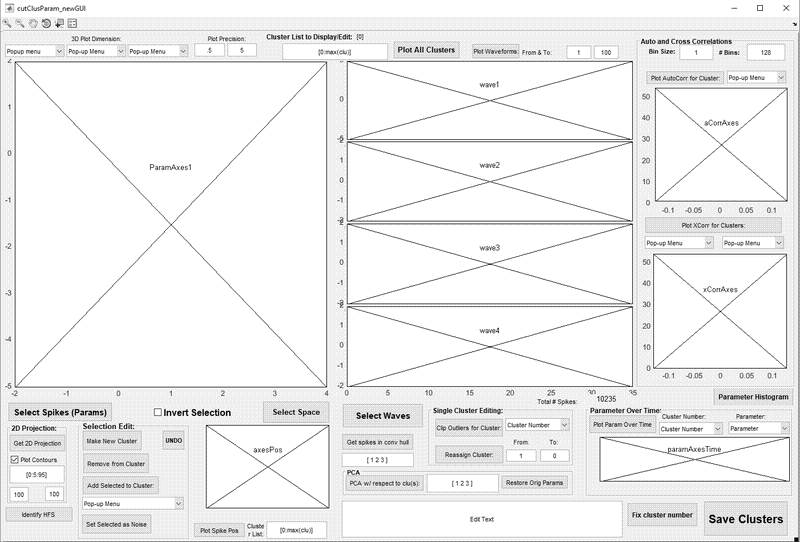
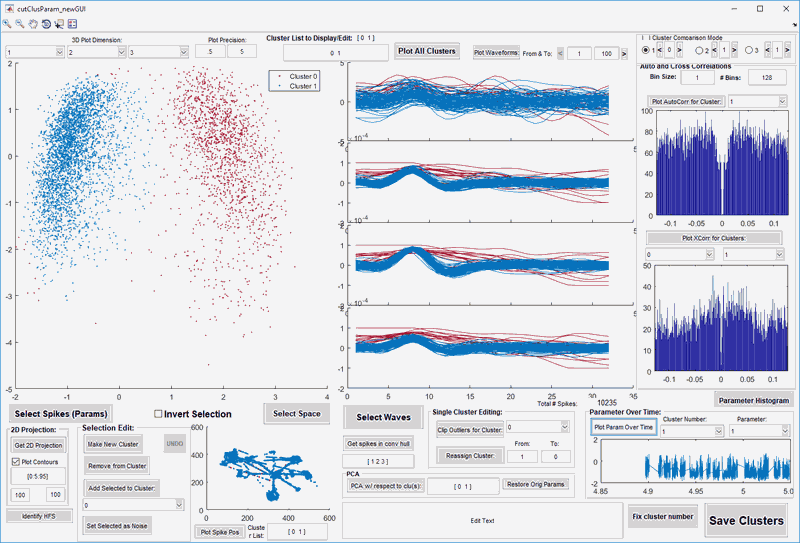
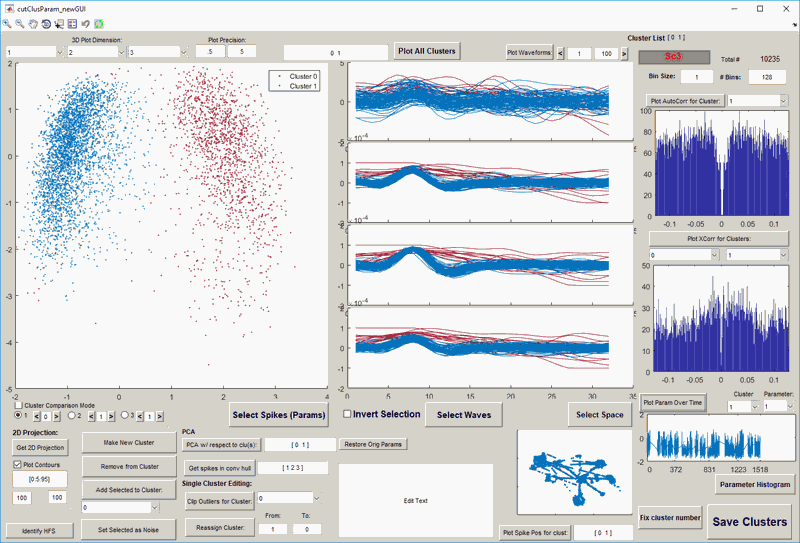
Wireframes & Prototypes:
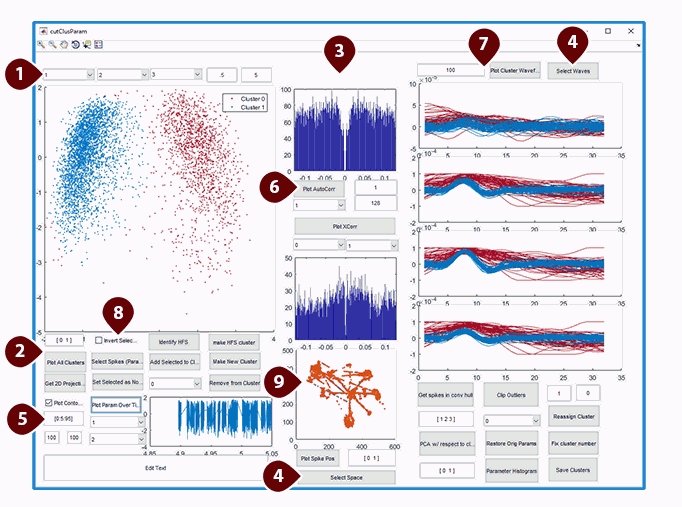
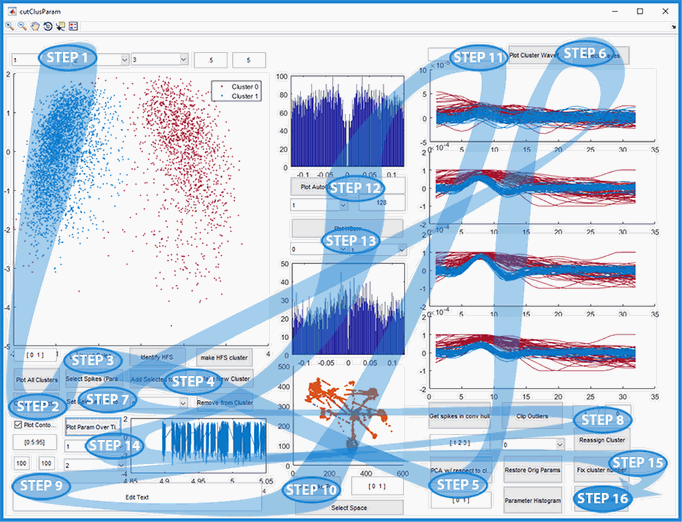
Since most changes could be done in GUIDES by adding labels or altering properties of existing interface elements, testing out multiple prototypes was easy and quick. These tests soon revealed the user-preferred layout. I focused on disambiguating the text in labels and hints, improving visual clarity and adding new functionality. Below are a few examples of the wireframes and prototypes I created and tested throughout this process.
Wireframes
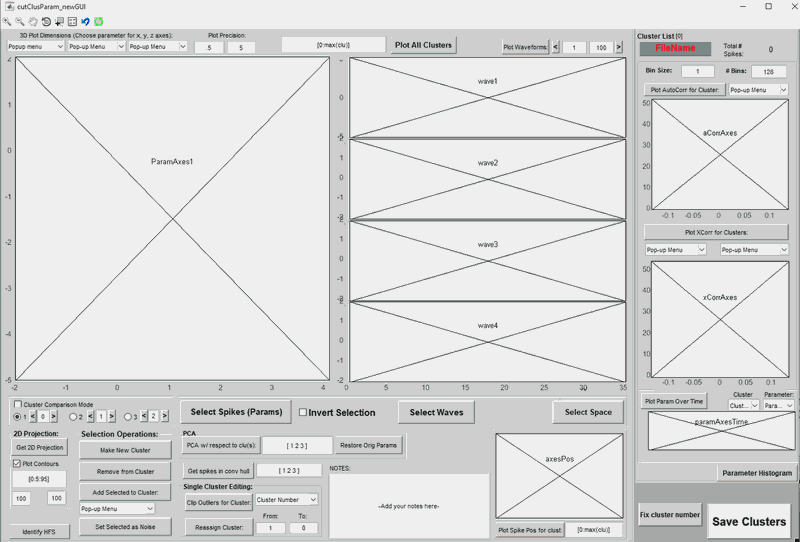
Prototype Screenshots
Designing Special Interactions:
During the redesign process I had to introduce new highly requested features and determine their appearance and behavior. Below is the specs sketch for the final interaction design that got the approval of most users and delivered the optimal workflow.
- "Previous Range" button. Purpose: while keeping the number of shown waves the same*, display waves which appeared in the file right before the current range. When pressed will recalculate the range, display the new range values in the "from" and "to" edit boxes and display the waves from the new range in the 4 wave plots below.
Special case behaviors:- Inactive when current wave range starts at 1.
- When the range size is bigger than there are preceding waves in the file, reset the "from" value of the new range to 1. (*This will reduce the total number of displayed waves.)
- "Next Range" button: Same as 1, but for loading the next set of waves after the current range.
Special case behaviors:- Inactive when current wave range ends at the maximum number of waves in the file.
- When the range size is bigger than there are remaining waves in the file, reset the "to" value of the new range to the last available wave. (*This will reduce the total number of displayed waves.)
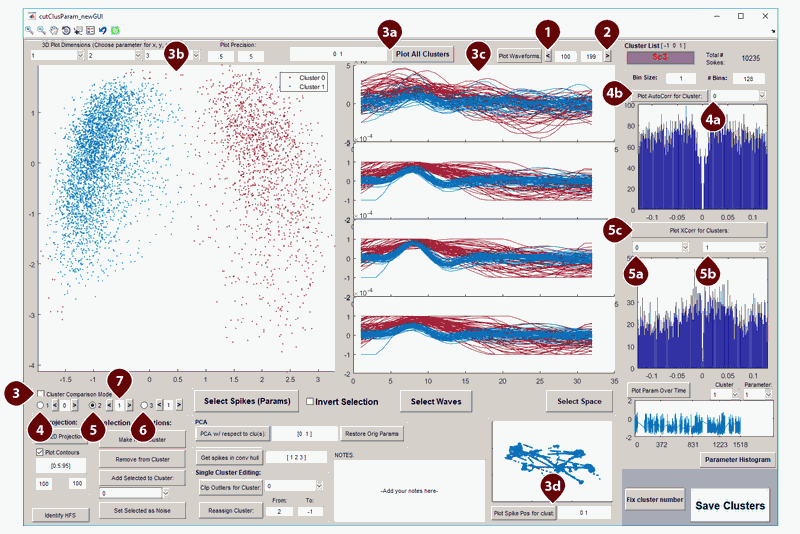
- "Cluster Comparison Mode" checkbox. Activates or deactivates the detailed preview and comparison of no more than 3 clusters at a time. Provides a quick way to switch between clusters and to compare each cluster to all the other clusters in the set - one by one or 2 at a time. Affected areas: Parameter 3D View 3a, shown clusters edit box 3b, 4 waveform plots 3c, space plot and shown cluster edit box 3d. Some modes also affect the auto-correlation plot and field, 4a &4b and cross-correlation plot and fields 5a, 5b & 5c
- "Single Cluster Preview Mode". When selected will display information in one cluster only. The displayed cluster number is determined by the edit box immediately to the right. Each alteration of that number will immediately update 3a, plots 3b & 3c, the full space area update in 3d, copy the cluster number value to 4a and execute button-press behavior on 4b to display the cluster's autocorrelation in the plot below.
- "2 Clusters Comparison Mode" option. Adds another cluster to be shown in all plots for detailed cluster-to-cluster comparison. Adds the cluster number from the edit box on the right to the shown cluster list and updates 3a, 3b, 3c & 3d. Has no effect on 4a and 4b. Instead uses the cluster number from edit box on the right to update the value in 5b and the cluster number from the edit box on left to update the value in 5a, then immediately triggers the execution of the button-press behavior on 5c to display the cross-correlation between the 2 clusters in the plot under 5a.
- "3 Clusters Comparison Mode" option. Adds another cluster to be shown in all plots for detailed comparison of 3 clusers. Each alteration of that number will immediately update 3a, plots 3b & 3c, the full space area update in 3d.
- "Previous Number" (<) and "Next Number" (>) buttons around each cluster number edit box. Provide a quick keyboard-free way to update the number in each edit box by selecting the previous cluster from the list (<), or the next cluster from the list (>). The edit boxes themselves have self-correcting limits: when the cluster number is not available in the cluster list, the closest available cluster number is automatically substituted into the box
Special case behaviors:- "<" button: Inactive when currently selected cluster number is the first cluster in the cluster list.
- ">" button: Inactive when currently selected cluster number is the last cluster in the cluster list.
Tests & Results
At each stage of the prototyping and developing process I conducted usability and benchmark tests to pick the most effective solutions.
Usabiliy Tests:
I developed sample data sets which represented commonly seen data examples and a couple standard scenarios for different common usage types to test the prototypes and final product updates. Whenever possible, I conducted the usability tests with both experienced users and recently trained or new users to estimate improvements to both long-lasting productivity and onboarding speed. During each session I took note of the user's comments, pain points and speed of task completion for each scenario and data set. The tests were either the same or very similar for each subsequent prototype or product update, allowing accurate estimations of the tested product's performance compared to other versions or prototypes.
Scenario Example:
Data Processing Experience:
General instructions: Please try to perform the following tasks to the best of your ability, taking as much time as you need to figure things out. Please narrate your actions and voice any comments or difficulties you might have as you go along.
- Use filtering and statistical aids on the screen to help identify the most prominent recorded neurons.
- Identify and isolate at least 5 individual neurons from this data set. You can use any data selection method available.
- Review each neuron carefully to ensure that all included waves are consistent. Make adjustments if necessary.
- Compare all neurons to each other and review their metrics to ensure that each definition's signal is clear and unique.
- Edit an identified neuron definition to clean up noise or divide its data into 2 different ones. Then merge the divided neurons back together.
Benchmark Testing:
I developed sample data sets for benchmark productivity testing of the product. To improve result interpretability I chose users with high proficiency levels in the tested version of the software. The users were given a task of fully processing files they haven't seen before. Their progress was observed and timed. The observations also provided insight into the workflow which skilled users were adopting to process large volumes of data. Some experienced users were also asked to conduct self-timed tests. Such sessions offered a more objective estimation of productivity improvements, since users had no interference from the knowledge of being observed.
Benchmark Test:
Self-timed benchmark test:
General instructions: Please fully process one of the included files. Please fill in the blanks as you go along.
File Name: ____________________________________
File Size: _________ mb
Processing start time: ________ AM/PM
Expected population size: ________neurons. (Visual estimation based on raw data)
Optional pre-processing:
Start time: ____________ AM/PM
End time: ____________ AM/PM
Pre-processed population size: ________ neurons.
Final population size: __________ neurons.
Processing end time: ________ AM/PM
Processed data confidence level: ________
Notes:
Results:
Comparison of initial usability tests for the inherited software to the same-scenario usability tests for the redesigned software showed the following improvements:
- Improved data processing rate by ~5 to ~40 minutes per file (depending on file size). A significant improvement with typically hundreds of large files per experiment. ⇢ U2
- Improved timing for data verification workflow by ~2 to ~20 minutes per file (depending on file size and data complexity). ⇢ U2, U3, B2
- New users familiar with the data processing methods but lacking prior training for this specific software had an easier time navigating and learning the new interface. The tool tips provided sufficient help to enable self-learning. ⇢ U1, B1, B3
- Unintended result: usability tests inspired a more efficient onboarding process. In lieu of traditional help files + tutorials approach, we designed sample data sets and provided initial live coaching sessions based on the sample data. With the redesigned interface this training method considerably reduced the learning curve and ensured a high level of proficiency in all trainees even after only a single training session. ⇢ U1, B1, B3
Workflow Improvements:
As shown in the "Inventory of Existing Issues" section above, the workflow offered by the initial interface
was inconsistent and confusing for most users. However, the workflow adopted by most users for the updated interface flowed naturally from left to right and offered an easy-to-learn logical process for the new users.
was inconsistent and confusing for most users. However, the workflow adopted by most users for the updated interface flowed naturally from left to right and offered an easy-to-learn logical process for the new users.